> ## Documentation Index
> Fetch the complete documentation index at: https://docs.bayboard.io/llms.txt
> Use this file to discover all available pages before exploring further.
# Scoreboard
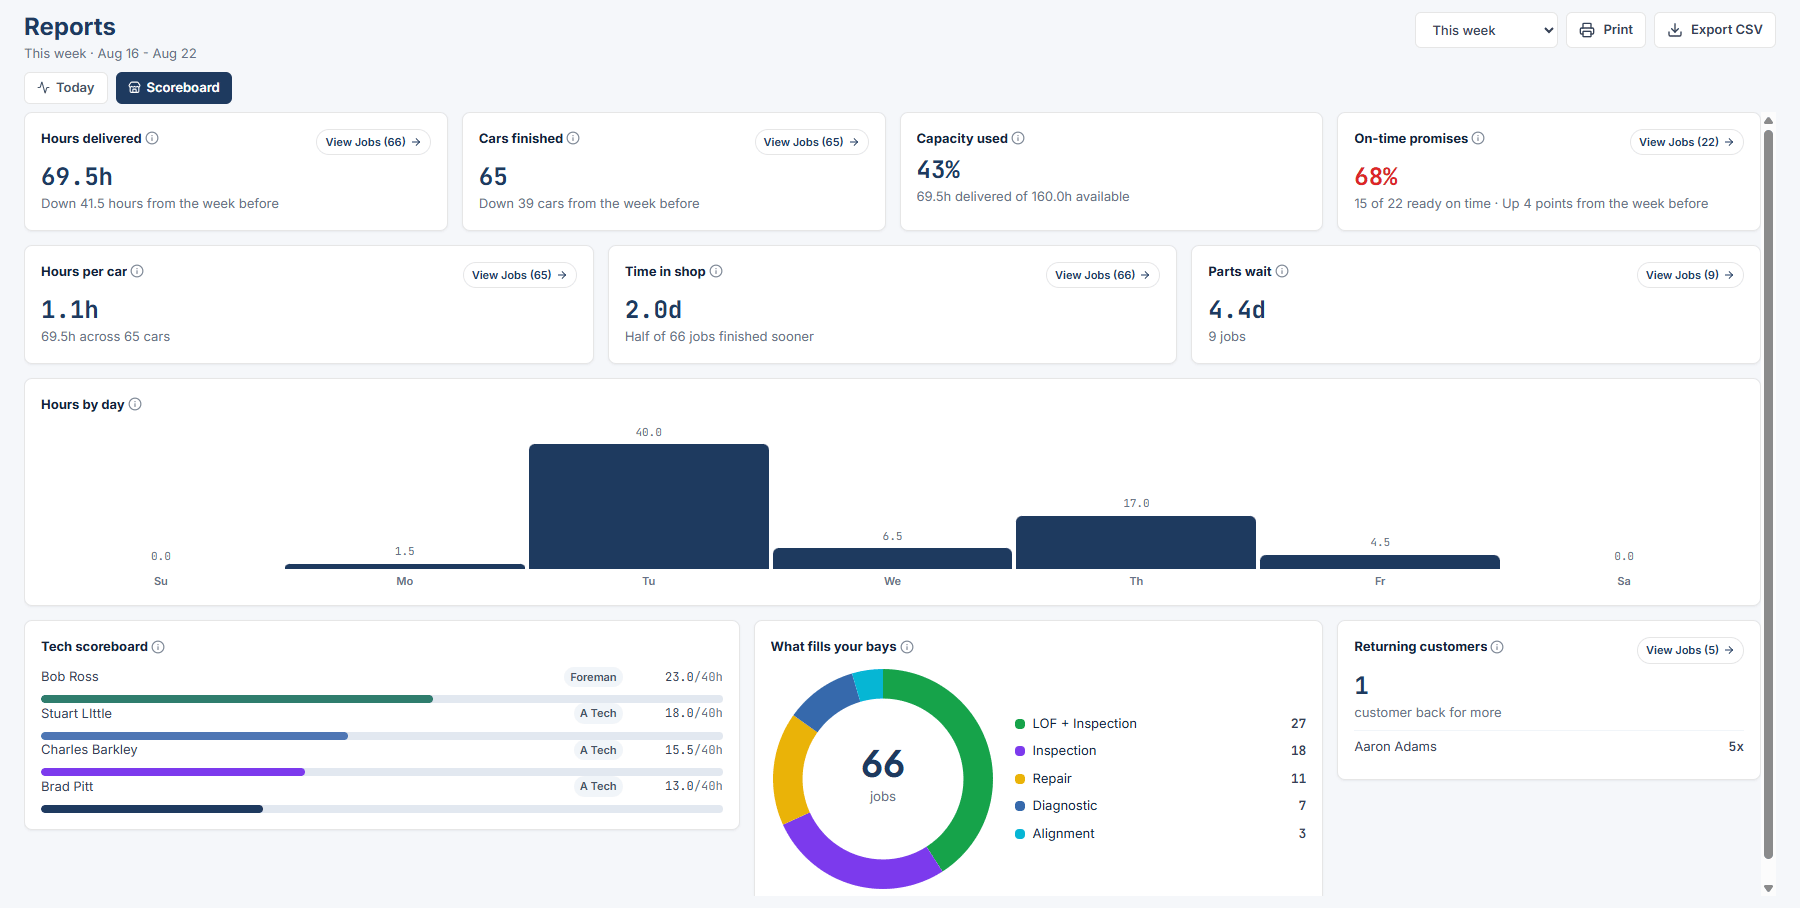
> Hours delivered, cars finished, and capacity used over a date range.
Scoreboard is the second lens in Reports. Owner / Admin, General Manager, Service Advisor, and Foreman can open it.
 ## Pick a range
Use the "Report range" select. The options are Today, This pay period, This week, Last week, This month, Last month, Year to date, and Custom.
Custom adds "Custom range start" and "Custom range end" date inputs. A custom range can cover at most 366 days. A longer range shows "Custom ranges are limited to 366 days. Narrow the range to run this report."
This pay period follows the Pay Period Configuration in Settings > General. See [Shop profile and hours](/getting-started/shop-profile-and-hours).
## The seven tiles
The first row compares each number with the period before. For example, "Up 6.5 hours from the week before".
| Tile | What it counts |
| ---------------- | --------------------------------------------------------------------------------------------------------------------------------------------------- |
| Hours delivered | Est. Hours added up across jobs completed in the range. |
| Cars finished | Vehicle visits with at least one job completed in the range. A visit with two jobs counts once. |
| Capacity used | Hours delivered divided by available hours. Available hours are each technician's DAILY GOAL (HRS) for every open day in the range, minus time off. |
| On-time promises | Of completed jobs that had a promised time, the share finished at or before it. |
| Hours per car | Hours delivered divided by cars finished. |
| Time in shop | The middle value of days from when a job was created to when it was completed. |
| Parts wait | The middle value of days from parts ordered to parts received, for parts that arrived in the range. |
Hover the info icon on a tile to see the same explanation in the app.
Every tile except Capacity used has a **View Jobs (n)** button that opens the jobs behind it. The button is hidden when there are no jobs to show.
## The four panels
* **Hours by day** is a bar chart. Click a bar to open the jobs from that day.
* **Tech scoreboard** lists each technician with name, tier, and a delivered-versus-goal hours bar. When the roster is empty it reads "No Techs on the roster yet."
* **What fills your bays** is a donut by job type. Click a segment to open the jobs of that type.
* **Returning customers** lists customers with two or more separate visits completed in the range. When empty it reads "No customer came back twice in this period."
## Open the jobs behind a number
Clicking a bar, a segment, or **View Jobs (n)** opens a panel on the right. Click an RO # to open that job's Job Details. The panel shows the first 200 rows with **Show All \[n]** to load the rest. A slice with no jobs reads "No jobs match this slice." Press Esc to close.
## Empty states
Before any work is finished, the lens reads "Once your team completes jobs, your Scoreboard fills in."
## Related
* [Today](/reports/today)
* [Export and print](/reports/export-and-print)
* [Add a technician](/team-and-roles/add-a-technician)
## Related topics
- [Export and print](/reports/export-and-print.md)
- [Today](/reports/today.md)
- [Reports](/reports.md)
- [Find your way around](/getting-started/find-your-way-around.md)
- [Users and access](/users-and-access.md)
## Pick a range
Use the "Report range" select. The options are Today, This pay period, This week, Last week, This month, Last month, Year to date, and Custom.
Custom adds "Custom range start" and "Custom range end" date inputs. A custom range can cover at most 366 days. A longer range shows "Custom ranges are limited to 366 days. Narrow the range to run this report."
This pay period follows the Pay Period Configuration in Settings > General. See [Shop profile and hours](/getting-started/shop-profile-and-hours).
## The seven tiles
The first row compares each number with the period before. For example, "Up 6.5 hours from the week before".
| Tile | What it counts |
| ---------------- | --------------------------------------------------------------------------------------------------------------------------------------------------- |
| Hours delivered | Est. Hours added up across jobs completed in the range. |
| Cars finished | Vehicle visits with at least one job completed in the range. A visit with two jobs counts once. |
| Capacity used | Hours delivered divided by available hours. Available hours are each technician's DAILY GOAL (HRS) for every open day in the range, minus time off. |
| On-time promises | Of completed jobs that had a promised time, the share finished at or before it. |
| Hours per car | Hours delivered divided by cars finished. |
| Time in shop | The middle value of days from when a job was created to when it was completed. |
| Parts wait | The middle value of days from parts ordered to parts received, for parts that arrived in the range. |
Hover the info icon on a tile to see the same explanation in the app.
Every tile except Capacity used has a **View Jobs (n)** button that opens the jobs behind it. The button is hidden when there are no jobs to show.
## The four panels
* **Hours by day** is a bar chart. Click a bar to open the jobs from that day.
* **Tech scoreboard** lists each technician with name, tier, and a delivered-versus-goal hours bar. When the roster is empty it reads "No Techs on the roster yet."
* **What fills your bays** is a donut by job type. Click a segment to open the jobs of that type.
* **Returning customers** lists customers with two or more separate visits completed in the range. When empty it reads "No customer came back twice in this period."
## Open the jobs behind a number
Clicking a bar, a segment, or **View Jobs (n)** opens a panel on the right. Click an RO # to open that job's Job Details. The panel shows the first 200 rows with **Show All \[n]** to load the rest. A slice with no jobs reads "No jobs match this slice." Press Esc to close.
## Empty states
Before any work is finished, the lens reads "Once your team completes jobs, your Scoreboard fills in."
## Related
* [Today](/reports/today)
* [Export and print](/reports/export-and-print)
* [Add a technician](/team-and-roles/add-a-technician)
## Related topics
- [Export and print](/reports/export-and-print.md)
- [Today](/reports/today.md)
- [Reports](/reports.md)
- [Find your way around](/getting-started/find-your-way-around.md)
- [Users and access](/users-and-access.md)