
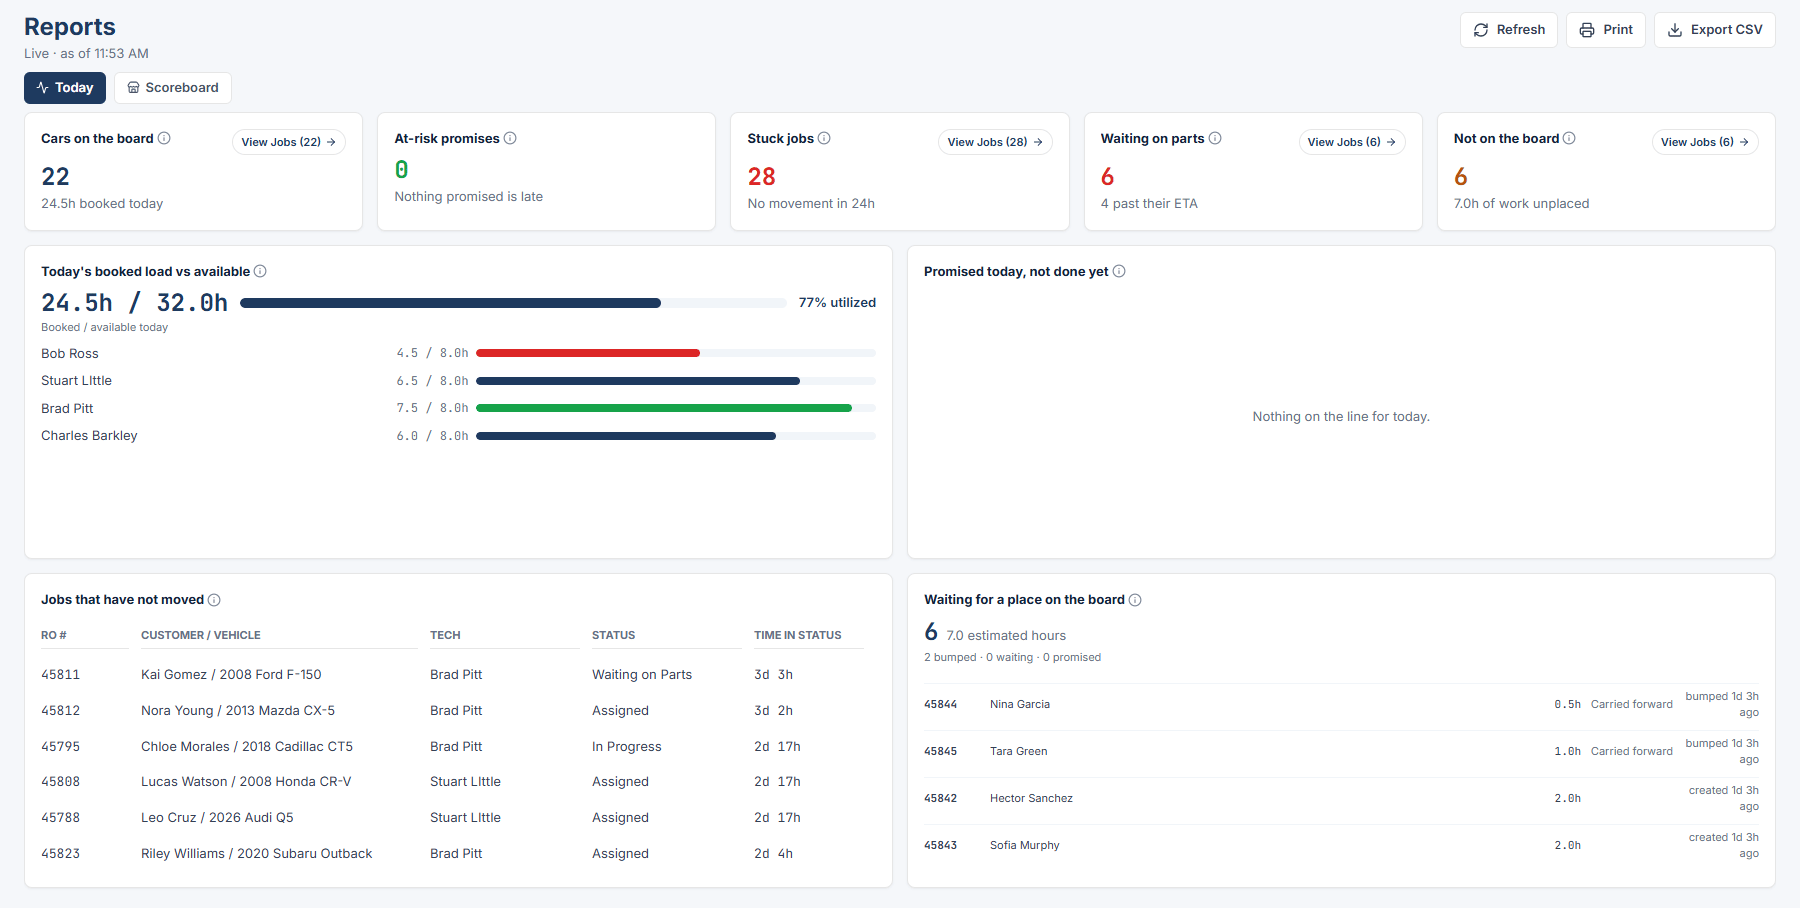
- Today is a live view of the board right now: what is on it, what is at risk, and what is stuck on the floor.
- Scoreboard shows delivered hours, cars finished, and capacity over a date range, compared with the prior period.
- My hours shows one technician’s own hours, pay period, and on-time completion rate for the work they finished.
Who sees which lens
Opening Reports lands on Today. Technicians land on My hours.
Pick a range
Today has no range picker. It shows “Live · as of [time]” with a Refresh button, and it refreshes again when you return to the tab. Scoreboard and My hours have a “Report range” select with these options: Today, This pay period, This week, Last week, This month, Last month, Year to date, Custom. Custom adds “Custom range start” and “Custom range end” date inputs. A custom range can cover at most 366 calendar days.Open the jobs behind a number
Every tile has a View Jobs (n) button. Bars and donut segments are clickable too. Each one opens a drill panel on the right that lists the jobs in that slice. Click an RO # in the list to open that job’s Job Details. Press Esc to close the panel.Export and print
Owner / Admin sees Export CSV and Print in the Reports header on Today and Scoreboard. See Export and print.If the report cannot load
You see “Reports could not load. Check your connection and reload.” with a Reload button.Today
Cars and promises.
Scoreboard
Hours and cars.
My hours
Hours by week.
Export and print
CSV and print.